
|
|


|



Title: Interactively adjust saturation and lightness for HSL gradients using PIL and Python
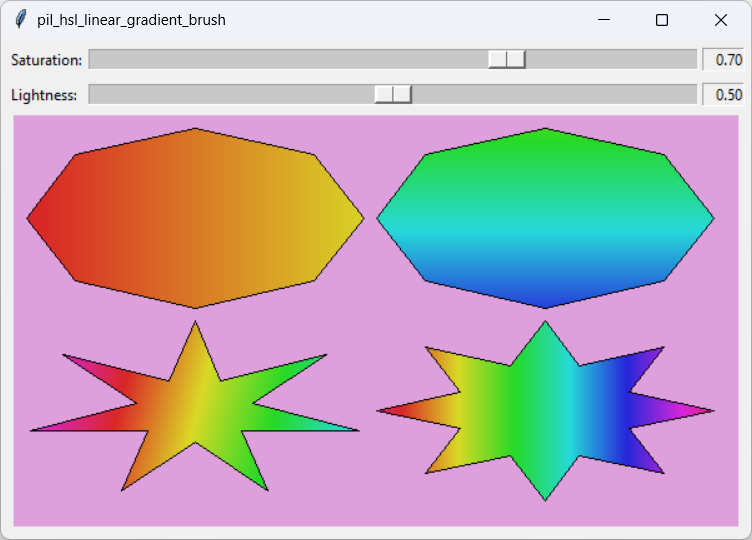
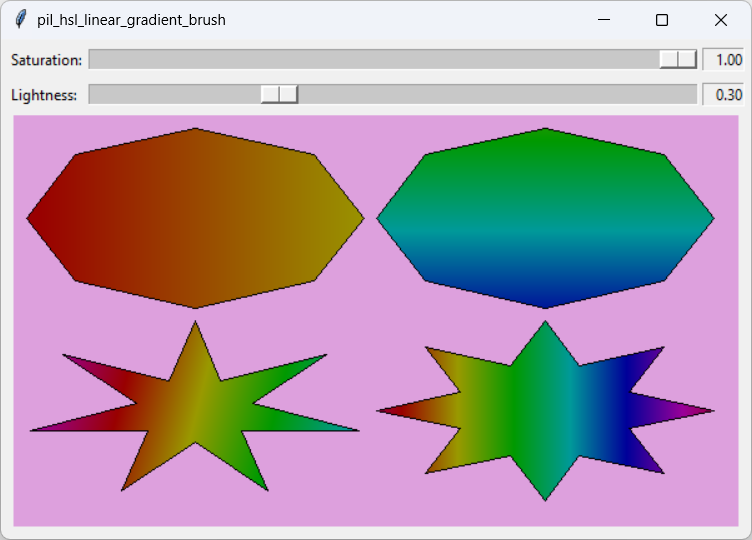
My post Make an HSL-based LinearGradientBrush class for use with PIL in Python displays some shapes filled with linear gradient brushes with colors specified using the HSL color model. All of the colors in those shapes used full saturation and normal lightness. This example lets you interactively adjust the saturation and lightness so you can more easily see what they do. Filling ShapesThis example is only slightly different from the previous one. Obviously its tkinter code has been modified to include two Scale widgets. It also has a few changes to its shape-drawing code so it can use the saturation and lightness values that you select.The following code shows how the program draws the shape in the upper left with the changes highlighted in blue. # Get the saturation and lightness. saturation = self.saturation_var.get() / 100 lightness = self.lightness_var.get() / 100 # Polygon 1. bbox = [margin, margin, margin + rect_wid, margin + rect_hgt] points = get_star_points(-math.pi / 2, 8, 1, bbox) start_hsl = [0, saturation, lightness, 255] # Red end_hsl = [60, saturation, lightness, 255] # Yellow xmin, ymin, xmax, ymax = bbox ymid = (ymin + ymax) / 2 start_point = (xmin, ymid) end_point = (xmax, ymid) brush = HslLinearGradientBrush(start_point, end_point, start_hsl, end_hsl) pil_fill_polygon(image, brush, points) dr.polygon(points, fill=None, outline='black') if show_points: pil_draw_circle(dr, start_point, 3, None, 'black') pil_draw_circle(dr, end_point, 3, None, 'black') The code gets the saturation and lightness values that you selected and divides them by 100 to convert the Scale values from a 0 to 100 scale to a 0.0 to 1.0 scale.The rest of this code is similar to the previous version except it uses the scaled saturation and light values that you selected. The code that draws the other shapes is similar except it uses different shapes and different gradients. Understanding Saturation and LightnessThe main point of this example is to help you understand the difference between saturation and lightness.Saturation indicates how "pure" a color is. You can think of reducing saturation as like adding gray to the color. Lightness indicates how bright the color is. Increasing brightness is like adding white to the color while decreasing brightness is like adding black. Although both saturation and brightness dilute the color, they produce different results, as demonstrated by the following three pictures. The first picture shows its colors at full saturation and normal brightness. In the second picture, saturation is reduced to 70% as if you added some gray. In the third picture, lightness has been reduced to 30% as if you have added some black. 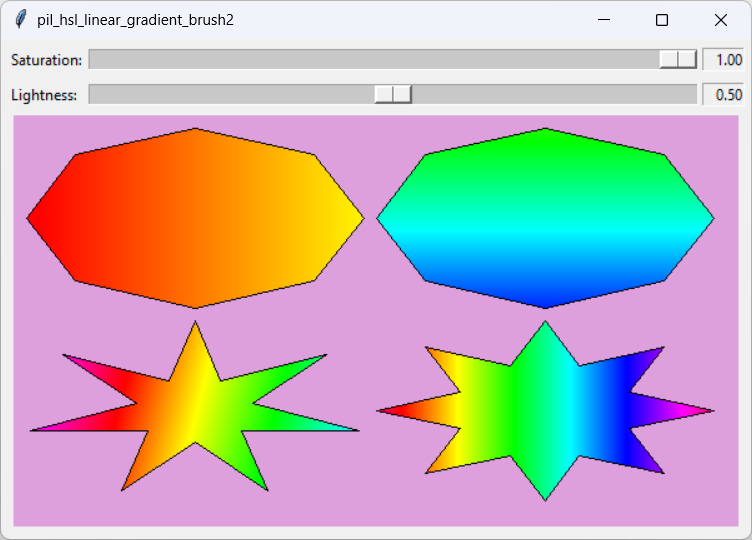
ConclusionSometimes the HSL color model is easier to use than the RGB model. In my next post, I'll show another example.Meanwhile, download this example to experiment with it and to see additional details. See the earlier posts for details about how to use gradient brushes, how to convert between the RGB and HSL color models, and how to draw stars. |